What is Text to Image Mapping
In the process of learning to map a line image to its corresponding text, in intermediate stage produces the alignment matrix via the attention component. We leverage this attention/alignment matrix to introduce a cool feature of Text to Image and Image to Text Mapping.
Alignment Matrix
The attentions produced at each time step, can be viewed as a probability distributions indicating the decoder to pay-attention to a certain features of the image. Using this matrix we find the location the model is paying attention at that time step. To see how this is done, visit this page:
Usage
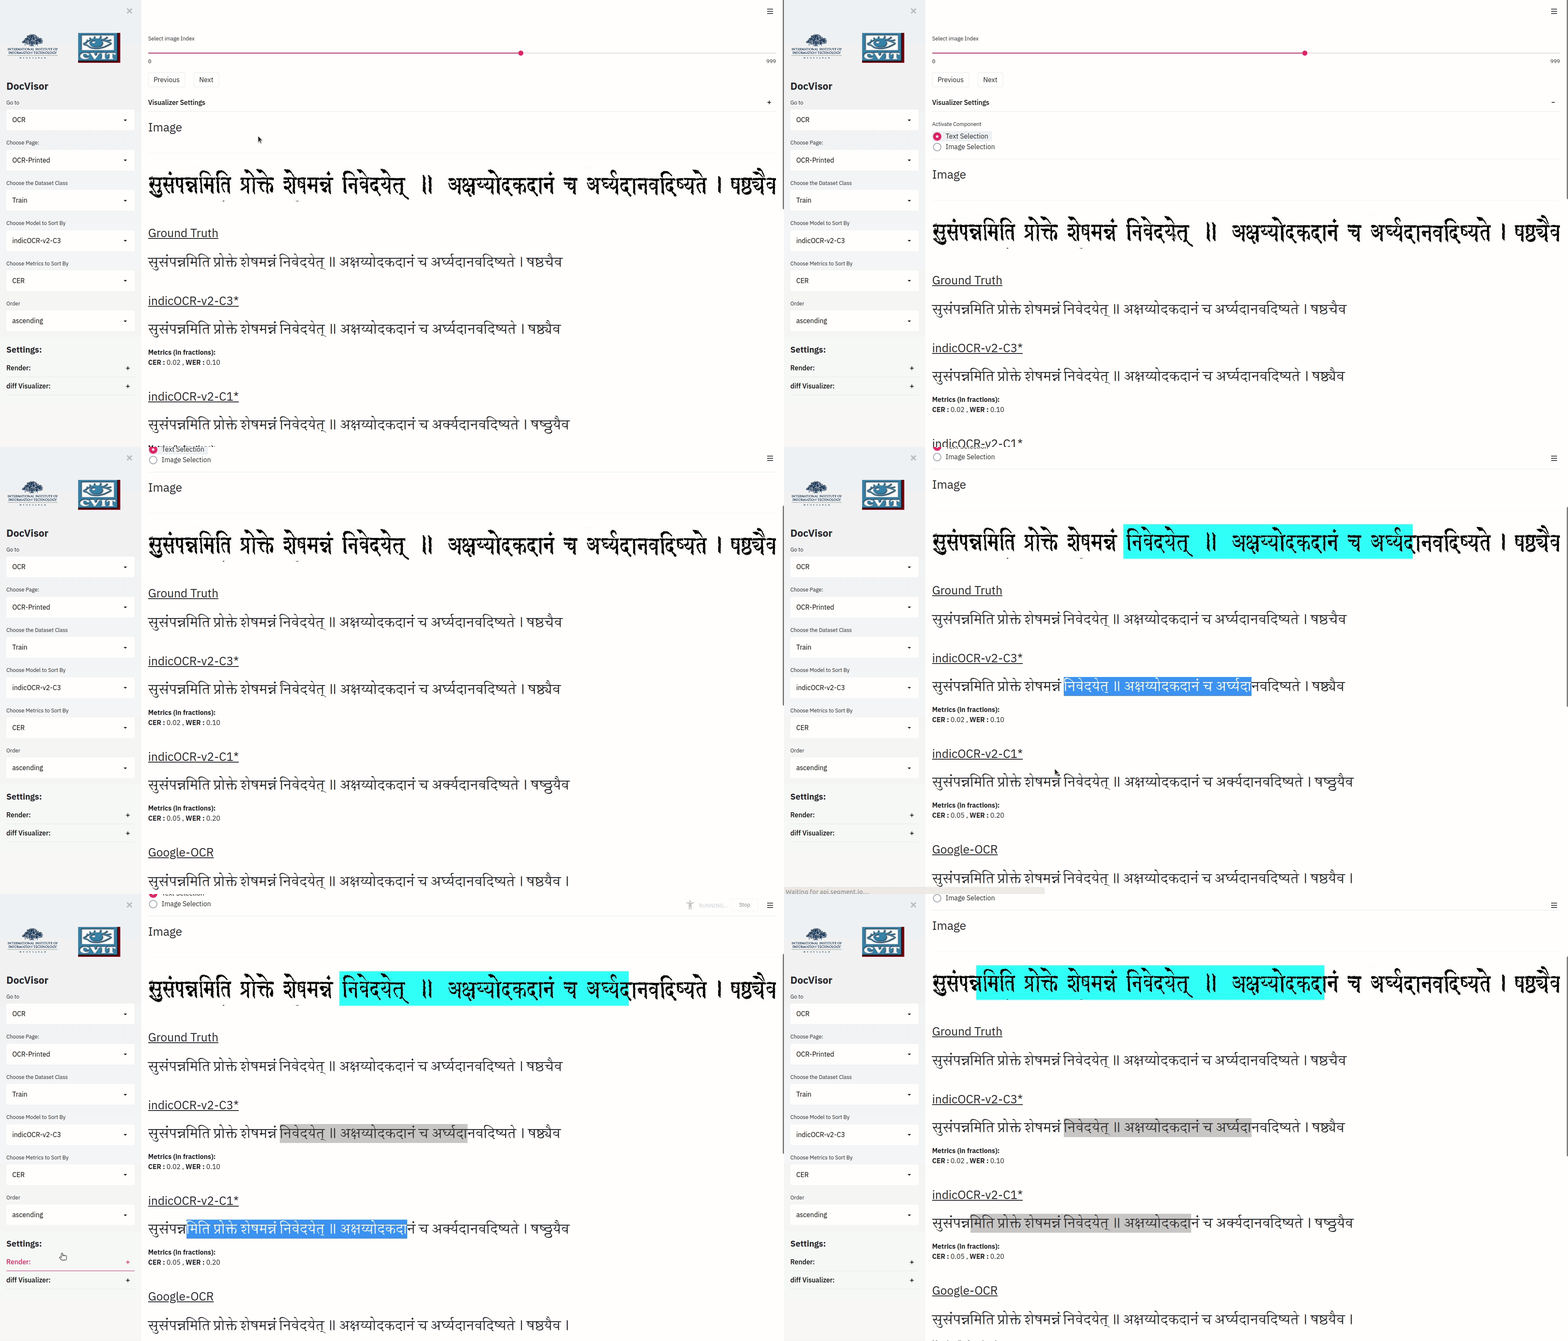
Step 1: In the Visualize Settings of the OCR-Layout, select the Text Selection Component.
Step 2: Select a any substring of the predicted text of any of the models that have attention in them.
Step 3: View the highlighted image.
The following gif should give you an idea of the Text Selection Feature and how cool it is.

Highlighting Color
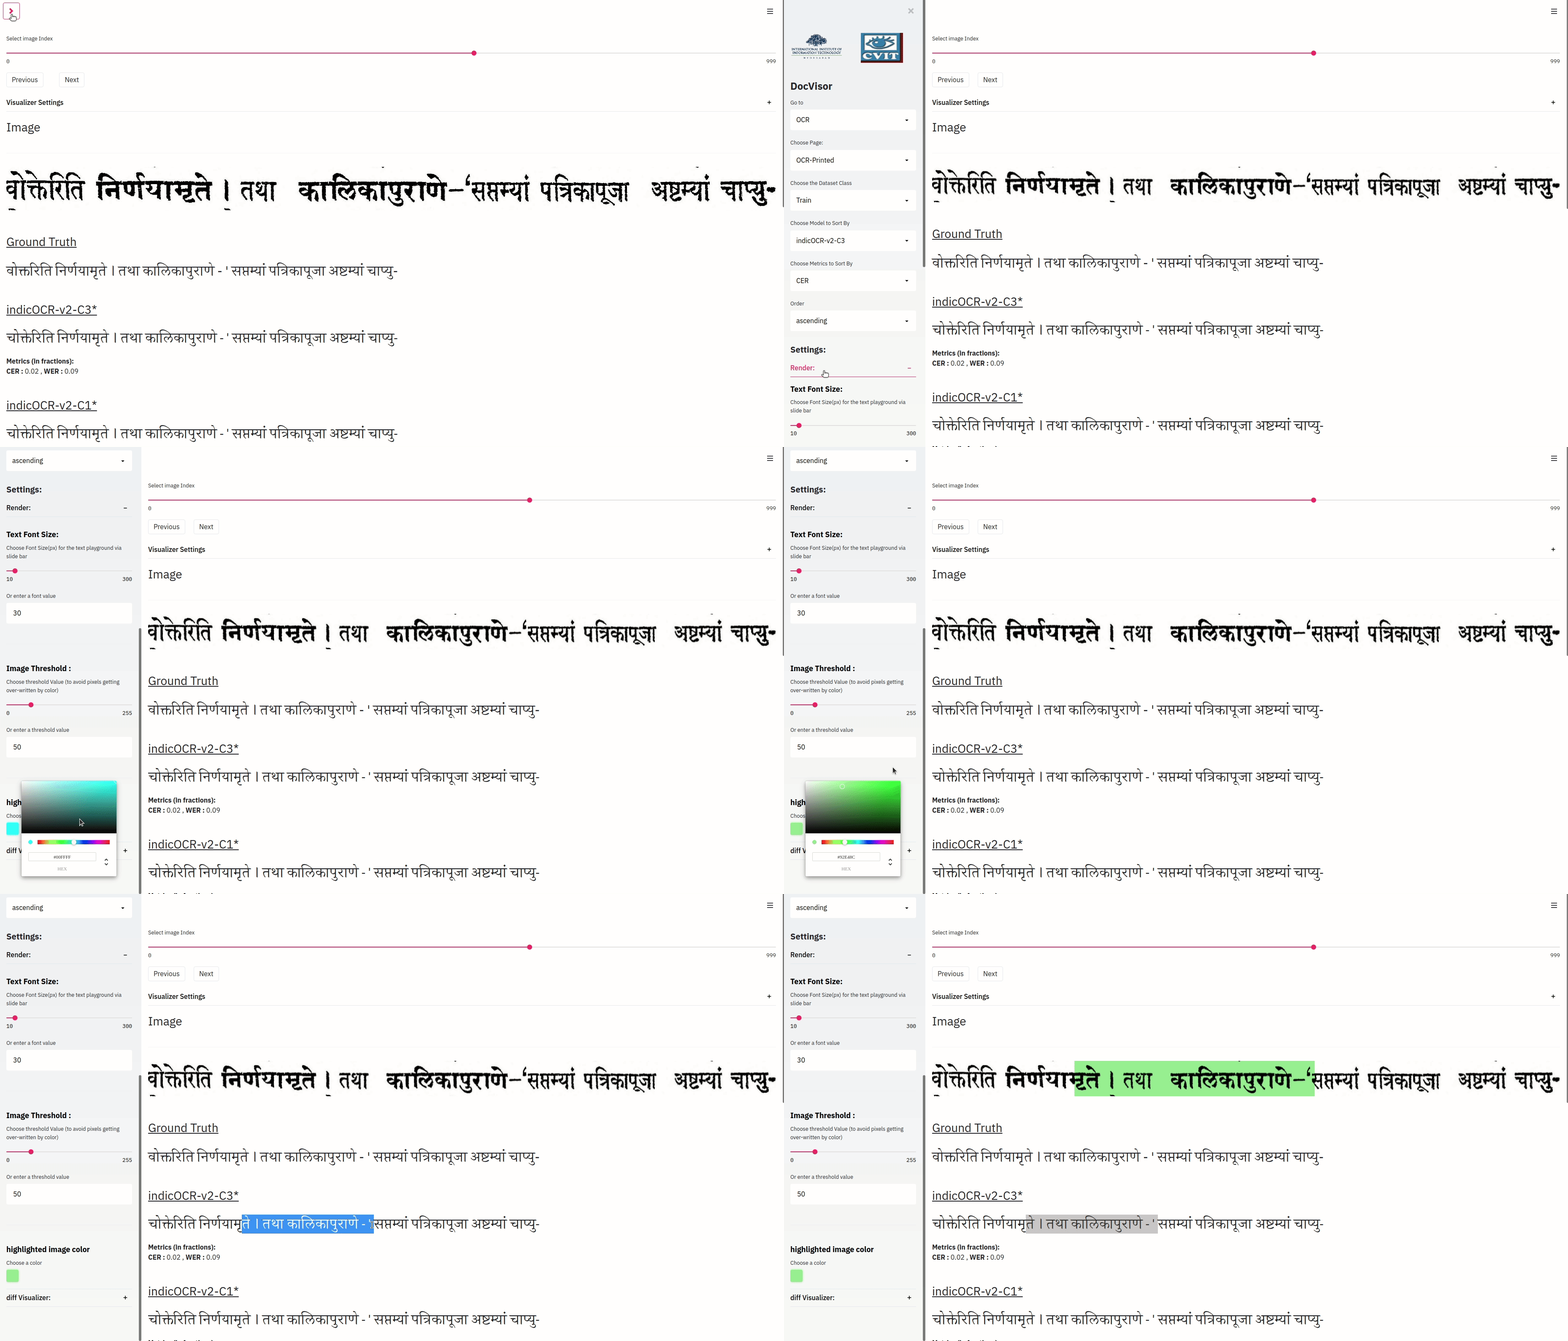
If the user wants to change the color used for highlighting the image, to a color that they like or to the one that is best suited for their image dataset, use the tool’s sidebar settings to do so.
- Open the sidebar (if it is not open)
- Expand the Render component under Settings
- Go to highlighted image color and choose the color of your interest.
The tool will now use this color for highlighting the image.
The following gif should help you understand what exactly needs to be done to use this feature.

Change Image Threshold
Many times the dataset may have images that are very blurr. For highlighting, we have used an image threshold that best suites a black and white image. However, it is possible that users may have images that are in gray scale, and on selection of a substring of the predicted text, you loose importan character pixels to the highlighted color. To avoid this we have allowed the user to tweak this and set it to a value best for their dataset/purpose.
To do so, follow the below steps:
- Open the sidebar (if it is not open)
- Expand the Render component under Settings
- Go to Image Threshold and choose the threshold value that bests suits your dataset.
Text Font Size
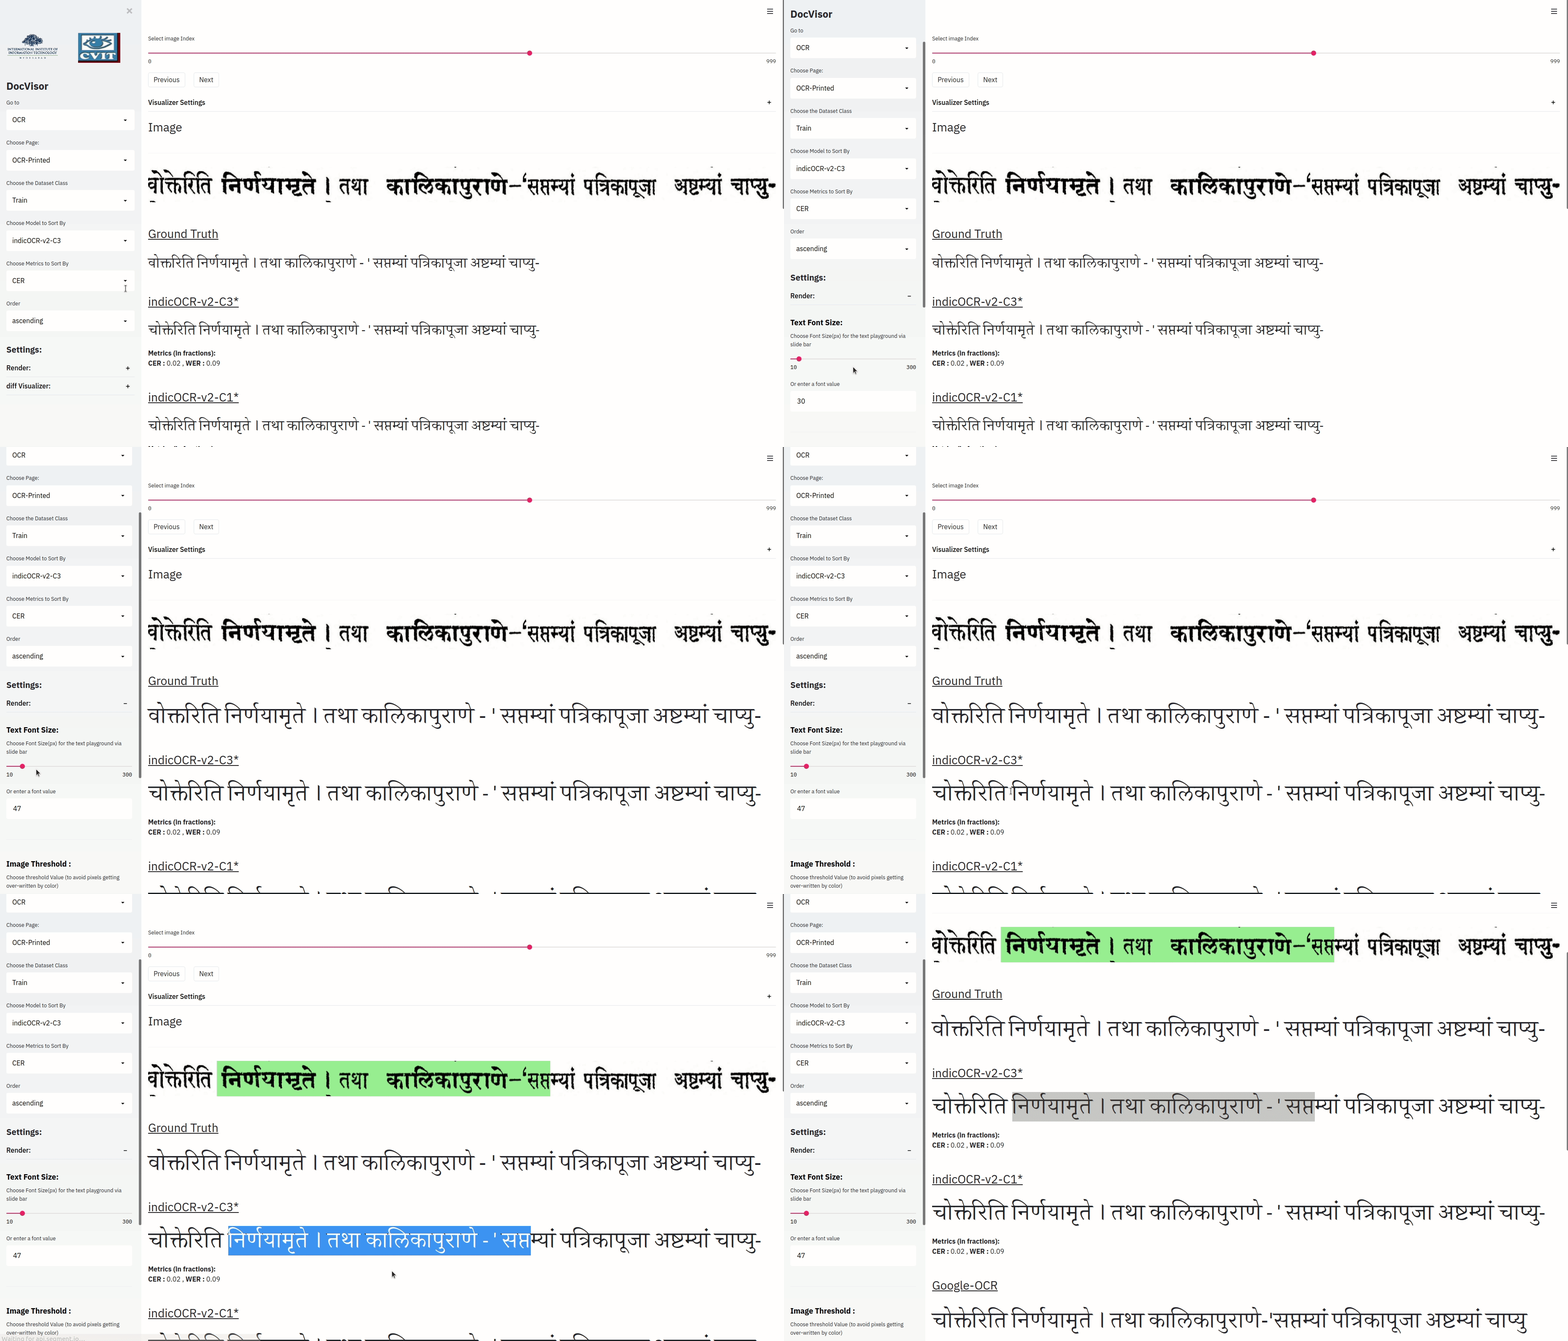
For purpose of easy-visualization, users might want to aling text along with the characters in the image. To do so, follow the steps below:
To do so, follow the below steps:
- Open the sidebar (if it is not open)
- Expand the Render component under Settings
- Go to Text Font Size and choose the font-size value that bests suits the image/dataset.
The following gif should help you understand the feature.
